From Market Data to Decision: Designing the Modern Trading Workflow
Charts sit at one end of the workflow and order buttons at the other. Most of what determines whether the workflow is disciplined happens in between, and in the review that closes the loop.
Editorial note. This is a technology article about how trading software is structured. It is not financial advice, it does not recommend securities or strategies, and it makes no claim that any workflow or platform produces profits. Trading involves risk of loss.
Most trading tools are built around two things: a way to look at the market and a way to act on it. Charts on one side, order buttons on the other. Everything a trader does between looking and acting happens in their head, in a notebook, or in a spreadsheet they built themselves.
That arrangement works, up to a point. It is also why so many trading processes are hard to repeat, hard to test and hard to learn from. The decisions are real, but the steps that produced them are invisible, so they cannot be examined, improved or checked for consistency.
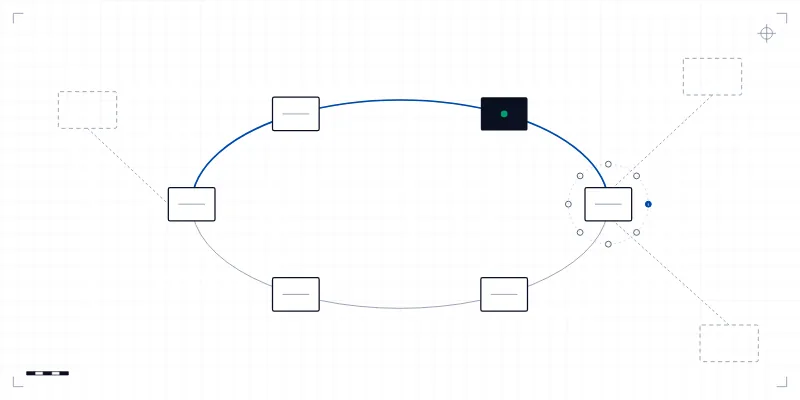
A more useful way to think about trading software is as a workflow: a chain of stages, each transforming what it receives and handing something narrower to the next. Designing that chain explicitly, with clear handoffs and a way to look back, is what separates a platform from a charting package with a trade button.
Market data: the stage everyone assumes is solved
The workflow begins with prices, volumes and order book depth arriving from the market. It is tempting to treat this as plumbing. It is not.
Raw market data has gaps, duplicates and occasional errors. Timestamps come from different clocks. Instruments are identified differently by different sources. Futures contracts expire and roll. Corporate actions such as splits and dividends change what historical prices mean. A system that ingests this data without normalising it will produce analysis that is subtly wrong in ways that are very hard to spot later.
Good systems do the tedious work here. They map every source to a single internal representation of instruments, attach reliable timestamps, detect and flag gaps rather than silently filling them, and keep historical data adjusted consistently. Every stage downstream inherits the quality of this one. No amount of sophistication later compensates for a flawed foundation.
Information: turning prices into something you can reason about
Raw ticks are not directly useful to most decisions. They need to be aggregated into bars, summarised into indicators, and placed in context: where the price sits relative to recent ranges, what the rest of the market is doing, how volume compares with normal.
This stage is where charts live, and charts are a genuinely good tool for it. But they are one view of information, not the information itself. A workflow that treats the chart as the product tends to leave its computations locked inside a display, where they cannot be reused, tested or fed into anything else. A workflow that treats indicators as data, computed once and available to every later stage, can use the same values for display, for strategy rules and for review.
Analysis and strategy: writing the idea down
Analysis is where someone forms a view. Strategy is where that view becomes a rule. The distinction matters more than it sounds.
A view such as "this looks oversold and should bounce" is not something software can act on, test or evaluate. A rule is: enter when a specified indicator crosses a specified threshold, within specified hours, on specified instruments, and exit under specified conditions. Writing the idea down precisely is the single largest step in making a trading process disciplined, whether or not the rule is then automated.
Tools can make that step easier or harder. A visual rule builder lowers the barrier for people who do not write code. A scripting layer allows logic that visual tools cannot express. Either way, the output is the same kind of object: an explicit, versioned description of what the strategy does. In AlphaSync, both routes lead to the same pipeline, so that a strategy written visually or in Python behaves the same way from testing onwards.
A view is not something software can test. A rule is. Writing the idea down precisely is the largest single step towards discipline.
Testing: history, then live prices without real orders
Once a strategy is a rule, it can be tested. Testing on historical data, backtesting, shows how the rule would have behaved on the past. Testing on live prices in simulation, paper trading, shows how it behaves on the present without placing real orders.
Both are necessary, and both have well-known limits worth being honest about. A backtest is only as good as its data and its assumptions about execution: what price an order would really have received, what costs would have applied, whether there was enough volume to fill it. A strategy tuned repeatedly on the same history can fit the past closely while saying little about the future. Paper trading avoids some of these problems but not all, because simulated fills are still estimates.
The engineering principle that matters most here is consistency: the same strategy code should run in backtest, in paper trading and live, with the differences confined to where data comes from and where orders go. When each mode runs different code, discrepancies between test and live results are impossible to diagnose. When they share one path, the discrepancies can be traced to specific causes such as data, fills or timing.
Risk: the stage that says no
Between the strategy's intention and the market sits risk control. Its role is simple to describe: decide whether an intended order is allowed, and at what size. Its rules are usually unexciting: maximum position size, loss limits per trade and per day, margin utilisation caps, exposure limits across related instruments, and an emergency stop.
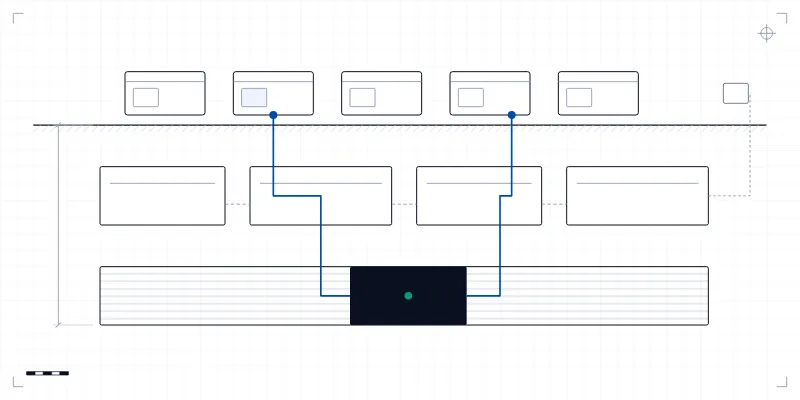
What makes risk control effective is its position in the workflow, not its sophistication. It must sit in the path of every order, so that no strategy and no user action can bypass it. It must be configured by the account holder, not the strategy. And it must be able to stop activity entirely, immediately, when a limit is reached or something looks wrong. We discuss the architectural side of this in why trading technology is a systems problem.
Execution and monitoring: acting, then watching
Execution is where the order leaves the system, is routed to a broker, and becomes something that happens in the market. It is also where the workflow meets the outside world's unreliability: partial fills, rejections, delays, disconnections. The system has to track each order through its lifecycle and keep its own picture of positions consistent with the broker's.
Monitoring is the stage that is easiest to neglect when things are going well. It covers the live state of strategies, positions and risk usage, but also the health of the system itself: is data arriving, are orders being acknowledged, are any limits close to being hit? Good monitoring is not a screen someone must watch continuously. It is a set of alerts that reach a person, by whatever channel they actually check, when something needs attention, together with the ability to pause or stop a strategy from wherever they are.
Review: the stage most tools skip
The last stage closes the loop. After trades have happened, what actually occurred? How did live behaviour compare with the backtest and with paper trading? Which differences came from the market, and which from execution, costs or data? Were risk limits hit, and were they set sensibly? Did the strategy do what it was designed to do, regardless of whether the outcome was a gain or a loss?
This is where most trading processes are weakest. Profit and loss is easy to see; understanding it is not. A workflow that records each decision along with its inputs (the data seen, the rule that fired, the risk checks applied, the order sent and the fill received) makes that understanding possible. A workflow that records only outcomes invites people to draw conclusions from luck.
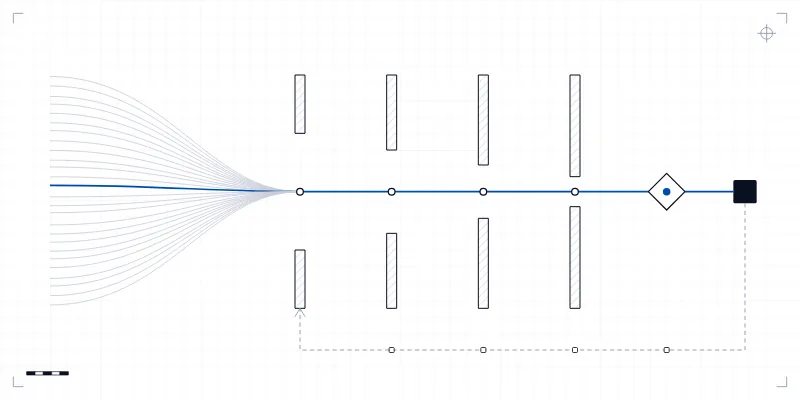
Review is also where the workflow learns. Findings flow back to the earlier stages: a data problem to fix, a rule to refine, a limit to adjust, a cost assumption to correct. Without that return path, the same mistakes repeat, because nothing connects the outcome to its cause.
Why the stages have to be designed together
It would be possible to assemble this workflow from separate tools: a data vendor, a charting package, a spreadsheet for rules, a broker's own terminal for orders, and a notebook for review. Many people do. The problem is the handoffs. Each boundary between tools is a place where information is retyped, reinterpreted or lost. The rule tested in one place is not quite the rule executed in another. The review cannot see what the strategy saw.
Designing the stages together means one representation of instruments and data throughout, one definition of each strategy used in every mode, one risk layer in front of every order, and one record of everything that happened. It does not make any particular outcome more likely. What it does is make the process repeatable and inspectable, so that whoever runs it can see what it is actually doing.
That is the case for more than charts and buttons. Not that better software produces better results in the market, which no honest builder can promise, but that it makes the path from data to decision explicit enough to examine. Our FinTech work starts from that premise, and so does the four-step Design, Backtest, Paper trade, Go live sequence at the centre of AlphaSync.